Here we present short "How-to"-guides that contain the steps to successfully deploy one of a suite of analytical models or tools, produced or used by scientists in freshwater research. You will find short visual tutorials, help and some useful links.
Note that these tutorials were produced for the BioFresh Information Platform, the predecessor of the Freshwater Information Platform, and therefore the terminology used might be slightly different.
Where to find the tool
http://efi-plus.boku.ac.at/software/
What is this tool
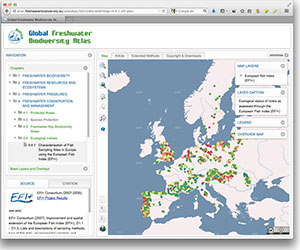
The European Fish Index (EFI+) tool enables you to evaluate the ecological status of riverine freshwater sites across Europe. It produces an index value for your site. It is a web based tool available on the EFI+ website. You must input your own data to enable the EFI+ to be calculated for a river site.

Why use it
The EFI+ tool uses a fish-based biological assessment method that meets the needs of the Water Framework Directive (WFD). It is built on a huge database (more than 14,000 sampling sites) that brings data on fish sampling, environmental conditions and human pressures together. The EFI+ indicates the ecological status of the investigated river in respect of its "biological quality element" fish in five classes from high (1) to bad (5). The index, therefore, is able to highlight the need for restoration measures to achieve a good ecological status in respect of the Water Framework Directive (WFD).
Using this tool
There are three vital steps to consider before using the EFI+ tool:
- You must collect your own data and present it in a particular format that is compatible with the EFI+ tool. There are 33 variables to record. You can see examples of the required variables and essential details of the EFI+ data format.
- Your data can be input directly into the EFI+ tool either manually or it can be uploaded straight away via a spreadsheet.
- Once you have collated the required data you are ready to use the EFI+ tool.
Watch a short introductory video how to use the EFI+ tool:
Problem solving
Access the EFI+ manual, a sample spreadsheet and/or read the EFI+ Frequently Asked Questions (FAQ) (PDF, 2 pages, 77Kb).
Contribute your findings to the BioFresh platform
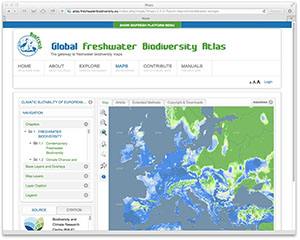
We invite you to contribute your data and/or results to the BioFresh platform. You can also see examples of existing EFI+ outputs in the online Global Freshwater Biodiversity Atlas: Characterisation of Fish Sampling Sites in Europe using the European Fish Index (EFI+).
References
EFI+ Consortium (2009). Manual for the application of the new European Fish Index – EFI+, Improvement and spatial extension of the European Fish Index [online], (PDF, 45 pages, 2.1mb) .
Pont D, Hugueny B, Rogers C (2007). Development of a fish-based index for the assessment of river health in Europe: The European fish index. Fisheries Management and Ecology 14: 427–439.
Schmutz S., Cowx I.G., Haidvogl G. & Pont D. (2007). Fish-based methods for assessing European running waters: a synthesis. Fisheries Management and Ecology 14: 369–380.
Where to find the tool
What is this tool
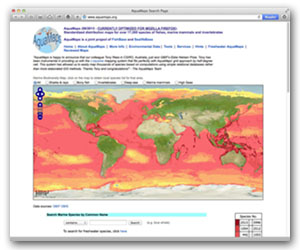
Freshwater AquaMaps is a tool for generating model-based, large-scale predictions of natural occurrences for species at a continental basin scale. The underlying model uses estimates of environmental preferences in terms of elevation, surface temperature, net primary productivity, soil pH, soil moisture, soil organic carbon, precipitation and compound topographic index.
Why use it
The Freshwater AquaMaps tool helps to identify areas for biodiversity conservation and provides an influential way forward for freshwater conservation. The Freshwater AquaMaps model has been standardised with input distribution maps for 69 European and 345 non-European species. The embedded Freshwater Checklist tool, for example, can generate a list of fishes reported in a given ecosystem, along with their corresponding native range and displayed as a biodiversity map.
Using this tool
There are a number of ways to make use of the AquaMaps tool:
- Search for freshwater species (n = 415)
- Access examples of European freshwater species occurrence data as well as the metadata sets created for BioFresh or use an interactive viewer for Freshwater AquaMaps as well as access 65 reviewed maps (offline due to technical problems, we are working on that (FIP-team, spring 2019))
Watch the "How to use Freshwater AquaMaps" video
Problem solving
See information about the Freshwater AquaMaps development including a description of the underlying algorithms and data sources.
Contribute your findings to the BioFresh platform
All data generated by AquaMaps is presented under a CC-BY-NC 3.0 licence and so can be freely shared for non-commercial use, provided that it is clearly identified as coming from AquaMaps, with a backward link to the respective source page.
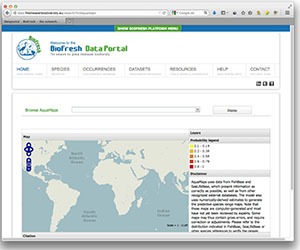
We invite you to contribute your data and/or results to the BioFresh platform. You can also see examples of existing freshwater AquaMaps output on the BioFresh Data Portal (offline due to technical problems, we are working on that (FIP-team, spring 2019)).
References
Kesner-Reyes, K., S. Kullander, C. Garilao, J. Barile, K. Kaschner and R. Froese. 2010. AquaMaps: algorithm and data sources for aquatic organisms. World Wide Web electronic publication. www.aquamaps.org
What is this tool
Key Biodiversity Areas (KBAs) are globally important areas for the persistence of biodiversity identified using standard criteria. They are identified nationally using simple, standard criteria, based on their importance in maintaining species populations.
Video – What is a Freshwater Key Biodiversity Area
Currently a KBA website is under development which brings together information on individual freshwater KBAs. As of May 2014 there are 8,423 KBAs identified based on fishes, odonates, plants and molluscs. New data will be added periodically.
Why use it
As the building blocks for designing the ecosystem approach and maintaining effective ecological networks, key biodiversity areas are a starting point for building comprehensive protected area networks. Governments, intergovernmental organisations, NGOs, the private sector, and other stakeholders can use key biodiversity areas as a tool for identifying national networks of internationally important sites for conservation.
Using the KBA information
- helps local authorities locate and prioritise improved catchment management for freshwater species
- helps guiding where new protected areas could be situated or how existing protected areas might be expanded to better protect freshwater species
- helps informing company development decisions to meet environmental safeguards standards
- helps informing local catchment research and identify where more research is needed
Using this this tool
There are a number of ways to make use of the KBA tool. You can:
- Access the Freshwater KBAs (website will be accessible soon).
Use the search options or map browser to retrieve freshwater KBA profiles. Each profile contains information on trigger species and may additionally have information on habitats, threats, conservation actions and overlapping protected areas.
Contributing to the KBA information
Help validate and keep the data up to date so this information resource remains of the highest value to all. If you have information to add to a KBA profile or if you would like to propose a catchment as a KBA please contact the Freshwater Biodiversity Unit at IUCN.
Contact FBU/IUCN: freshwater.biodiversity@iucn.org
Contribute your findings to the Freshwater Information platform
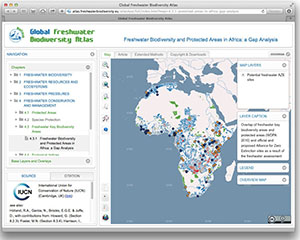
We invite you to contribute your results using KBAs to the BioFresh platform. You can also see examples of existing freshwater KBA maps in the online Global Freshwater Biodiversity Atlas: Freshwater Biodiversity and Protected Areas in Africa: a Gap Analysis.
References
Carrizo, S. F., Lengyel, S., Kapusi, F., Szabolcs, M., Kasperdius, H., Scholz, M., Markovic, D., Freyhof, J., Cid, N., Cardoso, A. C. and Darwall, W. (2014) Freshwater Key Biodiversity Areas Across Continental Europe: Identification, Prioritisation and Gap-Analysis.
What is this tool
The BioMatrix is a collection of datasets of the contemporary distributions and drivers of freshwater biodiversity. It is a “living” repository so that the addition of datasets is an on going process. Data are mapped to different spatial resolutions such as the HydroBASINS global catchments and WWF freshwater ecoregions. Datasets are grouped into taxonomic and regional groups for easier download. You can learn more about the BioMatrix from this short Freshwater blog article.
Why use it
The data are useful for any studies requiring knowledge on the location of one or more freshwater species or the spatial diversity of groups of freshwater species. A key benefit is that the data are mapped to catchments rather than an arbitrary grid. Freshwater species migrations, ecological processes and threat propagation occur via the catchment network and thus catchments provide the framework to improve the spatial understanding of the issues most pertinent to safeguarding freshwater biodiversity. In particular we use HydroBASINS, a global standardised hydrological framework that delineates catchments at multiple resolutions and includes network connectivity information.
Using this tool

You can access the BioMatrix distribution data downloads directly at www.iucn.org/species_BioFresh
The following maps are available:
- European Freshwater Fishes Spatial Data (14mb)
- European Freshwater Molluscs Spatial Data (12mb)
- European Odonata Spatial Data Download (12mb)
- European Aquatic Plants Spatial Data Download (25mb)
- Global Freshwater Crayfish Spatial Data (3mb)
- Global Freshwater Mammals Spatial Data (5mb)
All data generated from the IUCN Red Lists are presented under a CC-BY-NC 3.0 licence and so can be freely used for non-commercial use.
Problem solving
Details on the usage of the tool are given in the BioMatrix Manual.
Contribute your findings to the BioFresh platform
We invite you to contribute your data and/or results to the BioFresh platform. The BioMatrix will be integrated in the online Global Freshwater Biodiversity Atlas in due course. Similar maps (per organism group) can be seen here:
- Global Distribution of Freshwater Dependent Amphibians
- Global freshwater turtle species richness (coming soon)
- Global shrimp species richness (coming soon)
References
Carrizo, S. & Darwall, W. (2013). BioMatrix - METADATA. Contemporary distributions of freshwater biodiversity. BioFresh Deliverable 4.4.
What is this model
Species distribution models (SDMs) predict the potential distribution of a species in space and/or time. They are also known as environmental niche models, habitat suitability models or bioclimatic envelope models. Correlative SDMs are built based on the relationship between species’ occurrence and selected environmental variables. By using the field observations of species’ occurrences and environmental variables used as predictors, a number of algorithms can be applied to build SDMs that predict the habitat suitability of species in a wider landscape. These predictions can also be extended through time and thus provide future scenarios of species distributions. Common outputs of SDMs are maps of the probability of occurrence of the species through landscapes and/or through time (e.g. future, seasonal).
From the initial developments, SDMs have been broadened to be applicable to distinct taxa, non-terrestrial habitats, and using distinct environmental predictors beyond climate-only datasets. For the particular case of SDMs applied to freshwaters, habitat constraints as stream networks, lake patches, and costal buffers are also included. Also, different species use freshwater habitats exclusively, or they use multiple habitats (e.g. amphibians use both freshwater and terrestrial habitats).
Why use it
SDMs have been widely developed during recent years as they meet the needs of environmental research, resource management, and conservation planning. These developments result from the growing need of information on the geographical distribution of biodiversity and of the growing availability of data and techniques.
In the particular case of freshwater environments, SDMs are being used as tools for conservation and management purposes, from predicting species invasions to forecasting climate change impacts (e.g. Filipe et al. 2013; Domisch et al. 2013).
Building SDMs
Building SDMs applied to freshwaters is a complex task, and decisions made during the procedure depend on the aims of the particular study. Here we exemplify the particular case of forecasting stream fish species in Europe using the BIOMOD package of the R software and QGIS. The following text outlines the main steps for obtaining SDMs:
- Data preparation: Merge datasets of fish species occurrence and GIS environmental layers at comparable scales, regarding resolution (unit of analyses) and extent of data (area studied). Examples of environmental datasets:
- CCM2 is an online database of catchments and streams to use as basal GIS layer
- Worldclim climate data (present and future)
- Modelling: Calibration of SDMs using individual or joint algorithms (i.e., ensemble approach) in the BIOMOD package (R software), including selection of environmental predictors and of threshold of binary prediction. Example of algorithms are GLM (Generalized Linear Model), GAM (Generalized Additive Model), and MARS (Multivariate Adaptive Regression Splines).
- Modelling evaluation: Assessment of the predictive performance of the SDMs (e.g. AUC Area Under the Receiver Operator Curve statistics), including the significance of models for data not used in model
calibration (model validation). - Transferability. Transfer SDMs to future climates, if that is the aim for the study.
- Outputs from BIOMOD can be visualised using QGIS software and exported as a layout map file.
BIOMOD is a computer platform for ensemble forecasting of species distributions, which includes the treatment of a range of methodological uncertainties in models and the examination of species-environment relationships (see website for further reading).
QGIS is a user friendly open source Geographic Information System (GIS). For download and further information see QGIS website.
Problem solving
Detailed instructions and guidance on how to run the suite of models available in BIOMOD can be found in the Presentation Manual for BIOMOD. The version BIOMOD2 does not have a manual but rather a list of vignettes, accessible from within the software explaining the different steps to follow. In addition you can engage in user forums on the BIOMOD R-Forge page.
For QGIS support see QGIS website.
Contribute your findings to the BioFresh platform
Both BIOMOD and QGIS are open source softwares so you are encouraged to share your data with an open licence too. We invite you to contribute your data and/or results to the BioFresh platform. You can also see examples of SDMs built with BIOMOD in the online Global Freshwater Biodiversity Atlas:
Forecasts of Salmo trutta distribution in European basins

Climatic Suitability of European Stream Macroinvertebrates under Climate Change
References
For an overview of SDMs procedures:
Franklin, J. (2009) Mapping Species Distributions: Spatial Inference and Prediction, Cambridge University Press, Cambridge, UK.
Peterson, A.T., Soberon, J.M., Pearson, R.G., Anderson, R.P., Martinez-Meyer, E., Nakamura, M. & Araujo, M.B. (2011) Ecological niches and geographic distributions, (ed. by S.A. Levin and H.S. Horn) Princeton University Press.
For a scientific presentation of BIOMOD:
Thuiller W., Lafourcade B., Engler R. & Araujo M.B. (2009). BIOMOD – A platform for ensemble forecasting of species distributions. Ecography, 32, 369-373.
Some publications that exemplify the development of freshwater SDMs under the BioFresh project:
Filipe, A.F.; Markovic, D.; Pletterbauer, F.; Tisseuil, C.; De Wever, A.; Schmutz, S.; Bonada, N.; Freyhof, J. (2013). Forecasting fish distribution along stream networks: brown trout (Salmo trutta) in Europe. Diversity and Distributions, 19:1059-1071.
Domisch, S.; Araujo, M.B.; Bonada, N.; Pauls, S.U.; Jahing, S.C. & Hasse, P. (2013). Modelling distribution in European stream macroinvertebrates under future climates. Global Change Biology, 19:752-762.
Where to find the tool
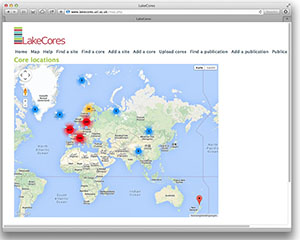
http://www.lakecores.ucl.ac.uk
What is this tool
LakeCores is a metadatabase designed to provide a global inventory of lakes from which sediment cores have been taken. It provides information on lake name and location, principal characteristics of the lakes e.g. size, altitude, depth etc. and the key characteristics of the cores, for example, length, age-span and so on. LakeCores also enables you to link the core data to publications or reports where the primary analytical details can be found.
Why use it
Anyone with appropriate data to contribute can do so by adding details of their sediment cores to the LakeCores database. This will help build LakeCores into a globally comprehensive register, useful not only for palaeo-scientists but also for lake managers concerned with changes in the water quality and biodiversity of lake ecosystems.
Using this tool
There are a number of ways to make use of the LakeCores tool. You can:
- Search for sites or cores in Europe or the rest of the world by corer type(s) and dating method(s) at the LakeCore website
- Access the LakeCores Locations map
- Watch the videos how to use LakeCores and how to upload core data.
- Link a publication with a core
Problem solving
Access the help section which has information about the LakeCores website.
Contribute to LakeCores and to the BioFresh platform
The LakeCores metadatabase is a community effort so it will increase as more data is added to it. Visit the LakeCore website. We also invite you to contribute your data and/or results to the Freshwater Information platform.
All data generated by LakeCores is presented under a CC-BY 3.0 (for content) and CC 0 (for data) licence and so can be freely shared for non-commercial use.
References
Battarbee, R.W., Morley, D., Bennion, H., Simpson, G.L., Hughes, M., & Bauere, V. (2011) A palaeolimnological meta-database for assessing the ecological status of lakes. Journal of Paleolimnology 45(4):405-414, link to article.
Where to find the tool
http://data.freshwaterbiodiversity.eu.
What is the data portal
A collaborative global freshwater biodiversity data hub - The aim of the data portal, which was started in the framework of the BioFresh project, is to integrate and provide open and free access to freshwater biodiversity data from all possible sources. It offers tools and support for scientists interested in documenting/advertising their dataset in the metadatabase, in submitting or publishing their primary biodiversity data (i.e. species occurrence records) or having their dataset linked to the BioFresh data portal. The information portal serves as a data discovery tool, and allows scientists and managers to complement, integrate, and analyse distribution data to elucidate patterns in freshwater biodiversity.
The data portal, how to contribute and further information can be found at data.freshwaterbiodiversity.eu.
Introduction to the Freshwater Data Portal
If you a freshwater scientist who wants to contribute data to the Freshwater Information platform, this video offers first insights in the use of the data portal.
Contributing to the Freshwater metadatabase
If you are a freshwater scientist who is interested in contributing searchable information ("metadata") about your freshwater biodiversity datasets to the BioFresh metadatabase, this tutorial helps you to get started. It includes information about requesting log-in information, accessing the metadatabase, and adding your information.
The Freshwater metadatabase can be found at data.freshwaterbiodiversity.eu/aboutmdb.
Using the data submission spreadsheet
If you are a freshwater scientist and would like to upload your primary biodiversity data to the Freshwater data portal, one option you can use is the Data Submission Spreadsheet. This tutorial gives a short video introduction to the spreadsheet for first-time users.
Download the data submission spreadsheet.