The eutrophication of lakes and rivers remain a global concern despite considerable efforts to reduce the input of nutrients from terrestrial environments. Nutrients and sediment have different sources in river catchments. They also come via different pathways. After targeting industrial and domestic sources, the diffuse inputs of nitrogen (N), phosphorus (P), and sediments became more important. In the European Union, diffuse sources affect now more water bodies than point sources.
Our model results showed that diffuse inputs ("emissions") ‑ often originating from agricultural areas ‑ contribute significantly to the total nutrient emissions in the German OSCAR case-study areas, i.e. the catchments of rivers Nahe and Stever (Figure 1). According to the climate scenarios, the years around mid-century will be hotter and wetter with drier summer seasons compared to 1976‑2005. More precipitation may lead to more water flow and both can increase the (re-)mobilization and the transport of nutrients and other agricultural pollutants such as pesticides. However, many other drivers are involved.
Various management practices can contribute to reduce the risk of pollutants entering water bodies. Riparian buffers stand among the most widely applied ones to reduce the diffuse pollution of surface waters, but also to provide habitats, to regulate water temperature, or to serve as aesthetic landscape element. This is reflected by the rich literature on their efficacy to retain substances from adjacent upslope areas.
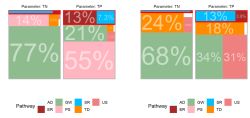
Fig. 1: Share of pathways on nitrogen and phosphorus emissions for the historical climate scenario, MONERIS results, left: Nahe, right: Stever catchment. The colours stand for the different modelled pathways, the numbers and size for their contribution to the total emissions. The abbreviations mean: atmospheric deposition (AD), erosion (ER), groundwater (subsurface flow, GW), point sources (PS), surface runoff (SR), tile drainage (TR), and urban systems (US), red rectangle: the pathways passing riparian buffers in the model, i.e. erosion and surface runoff.
From an extensive set of literature, we compiled the measured efficacy of riparian buffers to retain N, P, and sediment as well as information on generally available buffer and catchment properties. These properties were selected based on key drivers of nutrient and sediment retention processes discussed in the literature: buffer width, buffer vegetation (grassy, woody), soil texture, nutrient form (dissolved, particulate, or mixed), flow pathway (surface, subsurface), buffer slope, and buffer efficacy. 580 datasets from 139 studies were used to derive and assess different BBNs, in order to understand the interactions between these properties, to assess how model complexity influences the model performance, and to derive generalized knowledge rules.
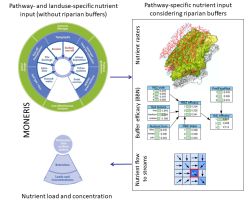
For the scenario runs, we combined the "best" BBN with the nutrient model MONERIS. MONERIS estimated pathway- and landuse-specific nutrient emissions for the about 60 sub-catchments in the Nahe and Stever catchments from statistical, environmental, and monitoring data. Its outcomes were rasterized to cumulate the emissions along flow pathways. For raster cells belonging to riparian buffers, we applied the BBN to estimate how much of the material can pass (Figure 2).
Preferential flow can be relevant in catchments but has hardly been investigated in empirical studies. We estimated the risk of preferential flow from the catchment area and integrated it into the BBN. With the (reduced) emissions of N and P to surface water, we calculated loads and concentrations in surface waters. Note, in contrast to the other functions, we considered riparian non-agricultural grassland as buffer. The OSCAR scenarios allowed us to evaluate local (based on emissions) and regional (based on loads and concentrations) effects of riparian buffers within the study areas.
Knowledge rules and BBN
Published efficacies of riparian buffers vary widely ‑ from 100% (complete retention) to negative values (i.e. riparian buffers act as nutrient source). They not only depend on buffer properties but also on the importance of nutrient pathways, management decisions, and time. These interactions and the limited data availability restrict any retention modelling.
Buffer width and slope as well as nutrient form and soil texture had a significant influence on the buffer efficacy, while flow pathway and vegetation type were of negligible relevance (Figure 3, left). In accordance to the literature, the BBN reflects that a high buffer efficacy was less probable for narrow than for wide buffers (Figure 3, right, a), for fine sediments than for coarse sediment (b), and for dissolved nutrients than for particulate nutrients (c). The influence of slope was less consistent (d) and depended on the nutrient form. For particulate and dissolved nutrients, the buffer efficacy declines with increasing slope. For TN and TP (“mixed”), the BBN shows lower efficacies for medium slopes. More (empirical) data is needed to disentangle and to revise the relationships.

Fig. 3: Results of the BBN assessments. Left: the importance of the tested variables (called “nodes”) differ widely, flow pathway and vegetation are the least important variables, right: the likelihood of efficacy values depends on the values of the other variables, higher class state values mean wider, steeper, and more efficient buffers.
The prediction errors are strongly related to the empirical, heterogeneous database which does not (and cannot) reflect equally well all the site characteristics influencing measured buffer efficacies. The assessment of BBNs revealed that the variables influencing buffer efficacy should have more than two values ("states"). In contrast, only two or three output values are meaningful. Firstly, the BBNs predicted the lowest and highest values much better than intermediate values. Secondly, more variables and values mean more combinations and a rapidly growing data demand. The available data amount was sufficient for the "best" BBN selected for the scenario runs (Figure 4).

Fig. 4: The selected BBN from the literature study (left) was extended by the conceptual node “risk of preferential flow” to adjust the BBN output (right). Preferential flow was obtained from the catchment area. We distinguished >0.5 ha (medium risk = 1), >1 ha (high risk = 2), and no risk (= 0) otherwise. Higher state values mean wider, steeper, and more efficient buffers.
Case-study scenario runs
Under reference conditions (historical climate data, baseline buffer scenario), about 7100 tons TN and 150 tons TP reach the water bodies in both catchments every year. The area-specific emissions in the Stever catchment are higher than in the Nahe catchment (Figure 5, left). The overall modelled effect of climate change on the emissions of TN (+1.5%) and TP (+3%) is stronger than the effects of the “best practice” and “pessimistic” scenarios (Figure 5, right).
Only a small part of nutrients enters streams via pathways that can be controlled by riparian buffers
The relevance of nutrient pathways depends on site characteristics which are highly variable. The same holds true for the extent of riparian buffers. Therefore, the already realized and the maximum possible reduction of nutrient emissions differ widely within the study areas (Figure 6, left). On average, about 80% of the emissions via soil erosion and surface runoff could be retained in both catchments under near-natural conditions (“ambitious”). 30% of this maximum potential is available in the Nahe catchment and 60% in the Stever catchment. However, in all scenarios, about 20% of the TP emissions and 5% of the TN emissions reach streams via surface runoff and soil erosion which limits the (modelled) potential of riparian buffers at catchment-scale (Figure 1).
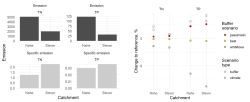
Fig. 5: TN and TP emissions under reference conditions (left, top: absolute, below: area-specific emissions) and effects of changes in climate and buffer extent on emissions (right).

Fig. 6: The maximum and realized potentials of riparian buffers to reduce total emissions and emissions via soil erosion and surface runoff (left) and the effects of changes in climate and buffer extent on nutrient concentration and load at the catchment outlets. The left figure confirms that the only a part of the nutrients is retained by riparian buffers. It also reveals that the (possible) reduction of nutrient emissions varies highly in space.
Climate change is expected to further reduce nutrient concentrations
The observed (Nahe) and modelled annual TP concentrations (both catchments) in the main rivers and main tributaries exceed the official orientation value of 0.1 mg/l (Nahe about 0.22 mg/l, Stever 0.14 mg/l). While concentrations hardly changed in the “best practice” and “pessimistic” scenarios, they decreased by 3% (Nahe) to 9% (Stever) in the “ambitious” scenario (Figure 6 right). Climate change is expected to further reduce concentrations. This is because annual water discharge is expected to increase, which will dilute the nutrient emissions. However, even in combination with the much higher extent of RBZ in the ambitious scenario, the model concentrations in the main rivers still exceed the official threshold for TP of 0.1 mg/l.
The effect of riparian buffers is highest in small streams (Fig. 7). In streams with a catchment size up to 100 km2, the reduction of total phosphorous was at a relevant scale. In the ambitious scenario, where RBZ are assumed to be developed in the whole riparian area, emissions are reduced on average by -40% and concentrations by -20%, while the average effect on total nitrogen was minor. The potential of RBZ to reduce nutrient loads and concentrations along main rivers is limited, although they can substantially decrease nutrient emissions locally (nutrient retention was highly variable – depending on the local woody buffer extent and site conditions – and locally as high as -80%). Consequently, additional on-site and off-site measures are needed to reduce the catchment-wide nutrient emissions and concentrations in larger rivers.
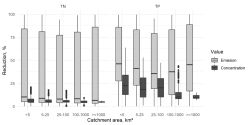
Fig. 7: The reductions of nutrient emission (light) and concentration (dark) by riparian buffers differ widely within the study areas. While riparian buffers retain efficiently emissions along tributaries (small catchment area) and main rivers (large catchment area), their impact on concentration in main rivers is limited. Ambitious scenario, similar for baseline.
"Design guidelines for buffers should consider multiple factors"
Although width is an important factor for the efficiency of riparian buffers, their efficiency depends on many more factors. For instance, while narrow buffers can already be effective for sediments and particulate nutrients, dissolved nutrients require broader buffers. The obtained best BBN could complement or replace simple design guidelines for riparian buffers but it is limited for more detailed predictions.
However, the empirical data from the literature requires a careful revision and application of the BBN. It may overestimate the efficacy of “real” buffers because much data comes from short-term studies. Additionally, some below-average values in our database are related to soil conservation (erosion control) or preferential flow. However, data is sparse as most studies were, e.g. conducted on small plots constructed with uniform slopes to avoid preferential flow.
"Climate change increases the risk of higher nutrient emissions which may require more, broader riparian buffers"
The future is always uncertain. Although the expected increase in precipitation will likely favor water discharge and nutrient emissions, the scenario runs may, however, underestimate the climatic risk. The use of long-term average monthly cannot consider extreme years and changes in the occurrence of short but highly intensive rainfalls. For Germany, various studies have reported that rainfall became more erosive. A further upward trend would have several implications, e.g. i) soil loss is underestimated, ii) more and faster-flowing water can reduce the residence time of nutrients in buffers, and iii) deposited material in the buffers could be mobilized. Narrow buffers might thus become insufficient.
"The reduction potential of riparian buffers is limited ‑ complementary measures are needed to reduce high nutrient emissions and concentrations"
Riparian buffers can only partly intercept (diffuse) nutrients and sediments emissions to water bodies. The planned measures (“best practice“ scenario) might be insufficient to mitigate a climate-induced future increase of nutrient emissions. This implies ‑ despite all the uncertainty ‑ that more on-site and off-site measures are needed to reduce nutrient (and sediment) emissions and concentrations and to improve the physico-chemical state of water bodies, including measures to reduce (TP) emissions from urban areas and industry.
In addition, the effect of riparian buffers on loads and concentrations depends on their location in the catchment. The already realized and potential effects are highest for riparian buffers in upstream areas (along small tributaries) but much lower in downstream areas (along main rivers).
"Are there other management options that could replace or support the here addressed function?"
Well-established measures exist which can complement but also interfere with riparian buffers. Buffers are off-site measures to retain mobilized material. On-site, optimized fertilizer application and soil conservation allow reducing effectively the amount mobilized material potentially entering buffers or rivers. Additionally, they can help to minimize groundwater pollution or soil degradation. While conservation tillage reduces sediment losses from arable land, the accumulation of water-soluble P pools in top soil and the development of macro-pores can unintendedly impair the buffer efficacy to retain soluble, immediately bioavailable P.
Aging buffers can turn from sinks to sources if poorly managed. For instance, dissolved P can be remobilized from P saturated buffer soils, P-rich colluvium can be remobilized during heavy rainfall or flood events, and nutrient can be released from decaying plant.
The mobilization and the transport of nutrients and sediment in river catchments are (indirectly) linked to the other functions under study in OSCAR.
- Ecosystem Services: The retention of sediment is included in the assessment of the service "Erosion control".
The in-stream retention of nutrient loads, as reflected in the service “Water quality improvement”, determines ‑ together with the emissions ‑ the nutrient loads, and in consequence the reduction potential of riparian buffers at the regional scale. - Biodiversity: Land use and (woody) buffers influence the composition and amount of nutrients entering buffers and water bodies and, in this way, are linked to the physico-chemical conditions and the macroinvertebrate communities. The nutrient uptake and release of riverine communities, in turn, plays an important role in the in-stream retention of nutrients.
- Temperature: Woody buffers can not only retain nutrients but also lower the (fluctuations) of water temperature. Water temperature determines the turnover of nutrients in rivers. In MONERIS, for instance, lower water temperatures decrease the denitrification. Nonetheless, the model sensitivity to temperature changes is small.
The BBN and the modelling framework can in principal be transferred to other catchments. The empirical data for the BBN covers a wide range of buffer and site characteristics in Europe (except Eastern Europe) and North America. However, the huge variation in buffer efficiency and the many involved processes and factors, including management, limits the precision of this (and any other simple) approach.
New, ideally regional data (empirical, modelled) is recommended to extend the database for the BBN training and validation, and to revise e.g. the assumed impact of preferential flow or the observed low impact of vegetation type on buffer efficacy. It is important to note that conditions not adequately considered in the database, such as soil conservation or the retention of subsurface flow, might be of relevance in other catchments. In particular the degree of P saturation of agricultural soils is important for the composition of P emissions and should be assessed carefully.
The model MONERIS is freely available from IGB Berlin. For the implementation of the raster-based approach, we relied on open-source tools. Small-scale and in-depth analyses may require additional and more representative (field) data as well as more process-based modelling approaches.
This document is based on two papers. The first one is freely available. It refers to many (scientific) studies, including review papers, and comes with the compiled database for the BBN.
Gericke, A. Nguyen, H.H., Fischer, P., Kail, J., Venohr M. 2020. Deriving a Bayesian Network to Assess the Retention Efficacy of Riparian Buffer Zones, Water 12(3), 617, doi:10.3390/w12030617
Gericke, A., Kail, J., Mahnkopf, J., Venohr, M. The effect of riparian buffer zones on nutrient emissions and loads ‑ A case study in two river catchments in western Germany, in preparation.
The nutrient model MONERIS has successfully been applied for river catchments and basins around the world. For more information on the model and its applications, please contact Dr. Markus Venohr at IGB Berlin.
This research has been funded through the 2015-2016 BiodivERsA COFUND call for research proposals, with the national funders German Federal Ministry of Education and Research (01LC1618A), Agence National de la Recherche (ANR-16-EBI3-0015-01) and Research Council of Norway (268704/E50). OSCAR project website
